Kornel Mazur

Setting Point Value, Tick Pip Step/Size for CFDs: A Step-by-Step Guide

When it comes to trading Contract for Difference (CFD), understanding the intricacies of the market is essential for success. One of the most important aspects of CFD trading is understanding the point value, tick pip step and size. In this article, we’ll explore these concepts, how to set them and provide recommendations for finding these values.

What are Point Value, Tick Pip Step, and Size?

Point Value: Represents the monetary value of one pip in the base currency of a CFD.

Tick Pip Step: Refers to the minimum price change of the underlying asset that a CFD can move in, expressed in pips.

Tick Pip Size: Represents the monetary value of one point in the base currency of the trading account, used to calculate potential profit or loss.

How to identify correct values in MT4/5?

First, you need to take a look at the chart for how many digits the instrument quoted.

You can see that this ticker is quoted for one digit.

  • Now you can see the contract size, which is the point value in SQ X, and it represents the monetary value for one pip.
  • In the next step, you need to set the tick pip step and size correctly. Tick size represents the value for one pip. Additionally, you will find the tick pip step, which represents the smallest incremental movement for one pip.

Please note that the instrument setting is not always accurate, and sometimes the broker may not even display the point value correctly. You may need to experiment with it a little bit to ensure accuracy.

It is highly recommended that the results be verified on the broker platform using a well-chosen strategy, ensuring that the backtest aligns seamlessly with SQX. In doing so, a greater sense of confidence and success will undoubtedly be achieved in your trading endeavors.

Get access to the #1 Dashboard for AlgoTraders

Setting Point Value, Tick Pip Step, and Size for CFDs in StrategyQuant

The instrument settings can effortlessly be edited in the data manager tab, empowering you to customize and optimize your trading experience with ease and precision.

Important note: Always, verify the results in the broker platform with some strategy and make sure that backtest matches with SQX.

Please, note that the point value in SQ X is calculated in USD so if some instrument is calculated in another currency for example AUD you need to convert the value to USD otherwise the results will be in the original currency

Examples of settings for Nasdaq CFD

IC Markets

Point value 1

Tick pip size 0.01

Tick pip step 0.01

Darwinex

Point value 20

Tick pip size 1

Tick pip step 0.1

Pepperstone

Point value 20

Tick pip size 1

Tick pip step 0.1

Dukascopy

Point value 1

Tick pip size 0.01

Tick pip step 0.01

Get access to the #1 Dashboard for AlgoTraders

F.A.Q.

Can I use the strategy developed on IC Markets with other Brokers?

The answer is yes and no. The problem with CFDs is that every broker can use their own settings of tick pip step/size and point value. So our recommendation is to always do the backtest on the target broker where you want to trade. If the backtest does not match the original, our recommendation is to build a new strategy.

Can I use the strategy developed for Futures data on CFDs?

No, the value of the tick pip step/size and point value is different, so the backtest in the platform will not match with the CFD broker.

What is Algo Trading and How Can You Get Started?

Algo trading, also known as algorithmic trading, is a form of trading that uses computer algorithms to automatically generate trading signals and execute trades. Algo trading is used by many professional traders and investors to take advantage of market inefficiencies and to reduce the amount of time and effort required to make trading decisions.

Algo trading is based on the use of computer algorithms to identify trading opportunities and execute trades. These algorithms are programmed to analyze market data and identify patterns that may indicate a profitable trading opportunity. Once a trading opportunity is identified, the algorithm will automatically generate a trading signal and execute the trade.

Algo trading can be used to trade a variety of financial instruments, including stocks, futures, options, and currencies. It can also be used to trade a variety of strategies, such as trend following, mean reversion, and arbitrage.

Getting started with algo trading requires a basic understanding of the markets and trading strategies. It is also important to have a good understanding of the different types of algorithms available and how they work. Additionally, it is important to have access to reliable data sources and a reliable trading platform.

Once you have a basic understanding of the markets and trading strategies, you can begin to develop your own trading algorithms. This can be done by using a variety of programming languages, such as Python, C++, and Java. Additionally, there are a number of software packages available that can help you develop your own trading algorithms.

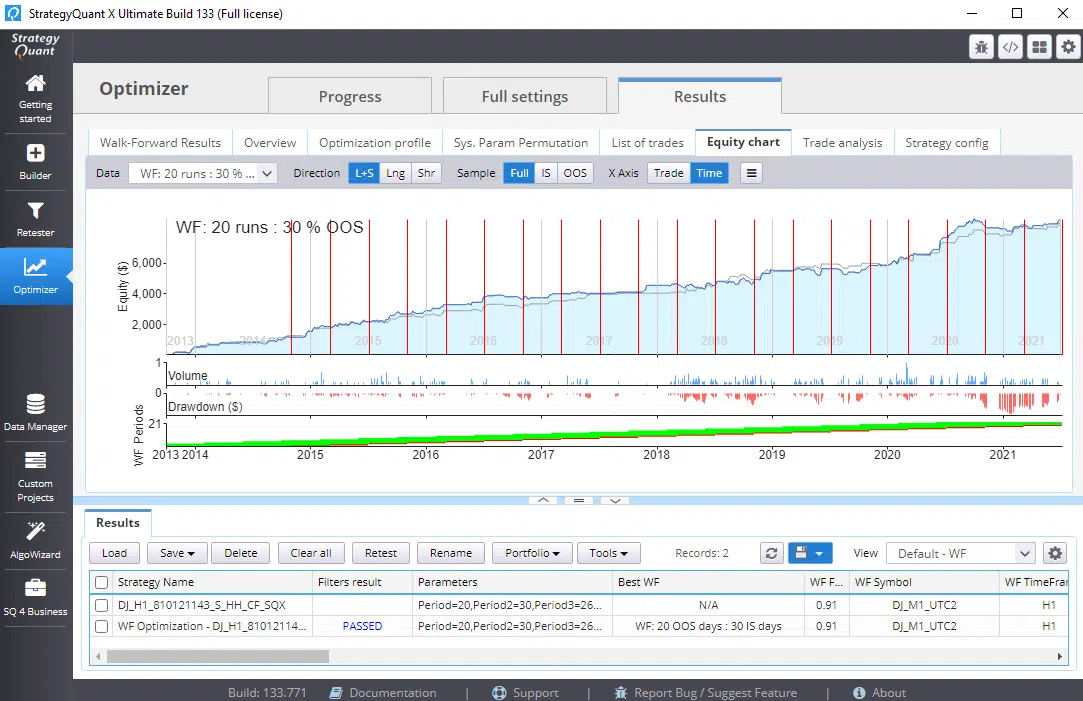
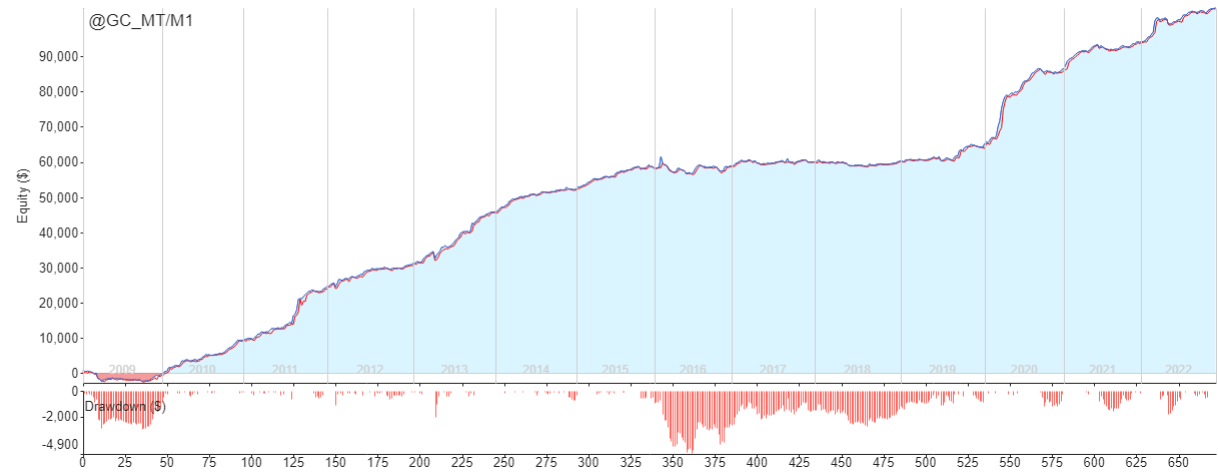
Once you have developed your own trading algorithms, you can then backtest them to see how they would have performed in the past. This will help you determine if your algorithms are profitable and if they are suitable for live trading.

Finally, you can begin to trade with your algorithms by connecting them to a broker or trading platform. This will allow you to execute trades automatically based on the signals generated by your algorithms.

Algo trading can be a powerful tool for traders and investors looking to take advantage of market inefficiencies and reduce the amount of time and effort required to make trading decisions. With the right knowledge and tools, anyone can get started with algo trading.

Understanding the Basics of Algo Trading Strategies

Algorithmic trading, also known as algo trading, is a form of trading that uses complex algorithms to make decisions about when to buy and sell financial instruments. Algo trading strategies are based on mathematical models that use historical data and market conditions to make decisions about when to enter and exit trades.

Algo trading strategies can be used to trade a variety of financial instruments, including stocks, futures, options, and currencies. These strategies are designed to take advantage of market inefficiencies and to reduce the risk associated with trading. Algo trading strategies can be used by both individual traders and institutional investors.

Algo trading strategies are based on a variety of factors, including market conditions, technical indicators, and risk management. Technical indicators are used to identify trends and patterns in the market, while risk management strategies are used to limit losses and maximize profits. Algo trading strategies can also be used to automate the trading process, allowing traders to focus on other aspects of their trading strategy.

Algo trading strategies can be divided into two main categories: trend-following strategies and mean-reversion strategies. Trend-following strategies are designed to take advantage of market trends, while mean-reversion strategies are designed to take advantage of market reversals.

Algo trading strategies can be used to trade a variety of financial instruments, including stocks, futures, options, and currencies. These strategies are designed to take advantage of market inefficiencies and to reduce the risk associated with trading. Algo trading strategies can be used by both individual traders and institutional investors.

Algo trading strategies can be complex and require a great deal of research and analysis. It is important to understand the basics of algo trading strategies before attempting to use them. It is also important to understand the risks associated with algo trading strategies and to ensure that the strategies are suitable for the trader’s risk profile.

How to Choose the Right Algo Trading

Platform


Algo trading is a form of automated trading that uses computer algorithms to execute trades. It is becoming increasingly popular among traders, as it can help to reduce the time and effort required to make profitable trades. However, choosing the right algo trading platform can be a daunting task. Here are some tips to help you make the right choice.

1. Research the Platform: Before selecting an algo trading platform, it is important to do your research. Look for reviews from other traders and read up on the features and capabilities of the platform. Make sure that the platform is reliable and secure, and that it offers the features and tools you need.

2. Consider Your Trading Style: Different algo trading platforms offer different features and tools. Consider your trading style and the types of strategies you use when selecting a platform. Make sure that the platform offers the features and tools you need to execute your strategies.

3. Look for Low Fees: Algo trading platforms typically charge fees for their services. Look for a platform that offers low fees and competitive pricing.

4. Test the Platform: Most algo trading platforms offer a free trial period. Take advantage of this to test the platform and make sure it meets your needs.

By following these tips, you can make sure that you select the right algo trading platform for your needs. With the right platform, you can make more profitable trades and reduce the time and effort required to do so.

The Benefits of Automated Algo Trading

Algorithmic trading, or algo trading, is a form of automated trading that uses computer algorithms to determine when and how to trade financial instruments. Algo trading has become increasingly popular in recent years due to its ability to execute trades quickly and accurately, as well as its potential to reduce transaction costs. In this article, we will discuss the benefits of automated algo trading.

First, algo trading can help traders make more informed decisions. By using algorithms to analyze market data, algo trading can identify patterns and trends that may not be visible to the human eye. This can help traders make more informed decisions about when to enter and exit trades.

Second, algo trading can help traders reduce transaction costs. By using algorithms to execute trades, traders can avoid the costs associated with manual trading, such as commissions and fees. Algo trading can also help traders reduce the risk of making mistakes due to human error.

Third, algo trading can help traders take advantage of market opportunities. By using algorithms to identify and execute trades, traders can take advantage of market opportunities that may not be available to manual traders. This can help traders maximize their profits.

Finally, algo trading can help traders manage their risk. By using algorithms to analyze market data, algo trading can help traders identify and manage risk. This can help traders reduce their exposure to risk and maximize their returns.

In conclusion, automated algo trading can provide many benefits to traders. By using algorithms to analyze market data, algo trading can help traders make more informed decisions, reduce transaction costs, take advantage of market opportunities, and manage their risk. As such, algo trading can be a valuable tool for traders looking to maximize their profits.

Tips for Developing Your Own Algo Trading Strategies

1. Start with a basic strategy: Before you start developing your own algo trading strategies, it is important to start with a basic strategy. This will help you understand the basics of algo trading and how it works.

2. Research the markets: Before you start developing your own algo trading strategies, it is important to research the markets. This will help you understand the different market conditions and how they affect your trading strategies.

3. Test your strategies: Once you have developed your own algo trading strategies, it is important to test them. This will help you identify any potential flaws in your strategies and make adjustments accordingly.

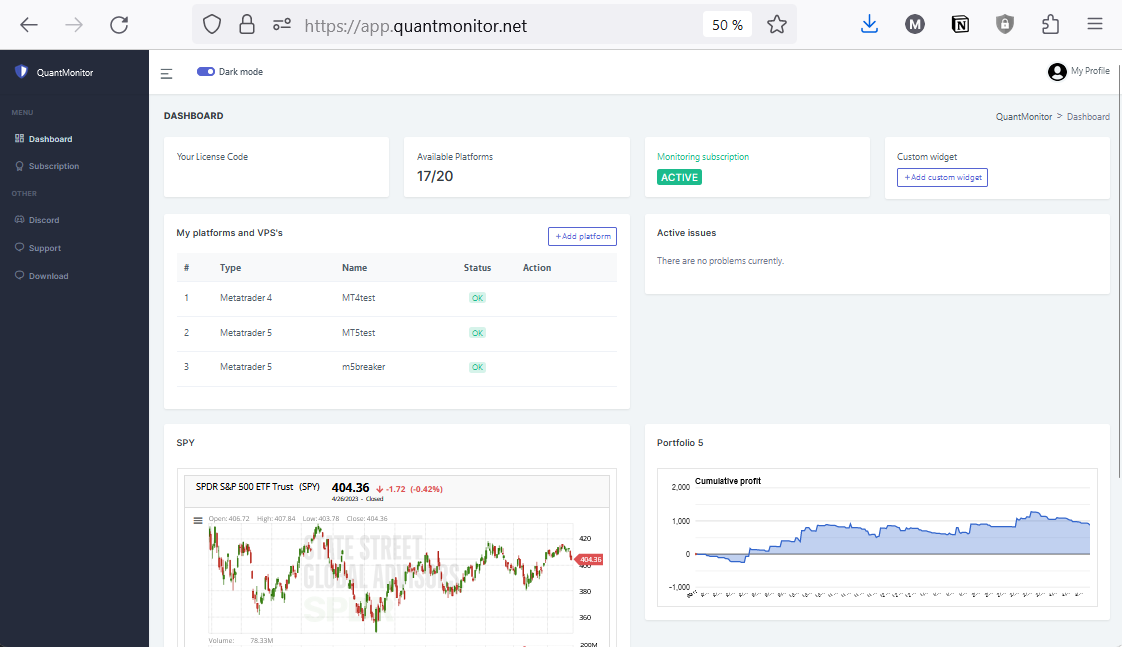
4. Monitor your strategies: Once you have developed and tested your algo trading strategies, it is important to monitor them. This will help you identify any changes in the markets that could affect your strategies and make adjustments accordingly.

5. Backtest your strategies: Backtesting your strategies is an important step in developing your own algo trading strategies. This will help you identify any potential flaws in your strategies and make adjustments accordingly.

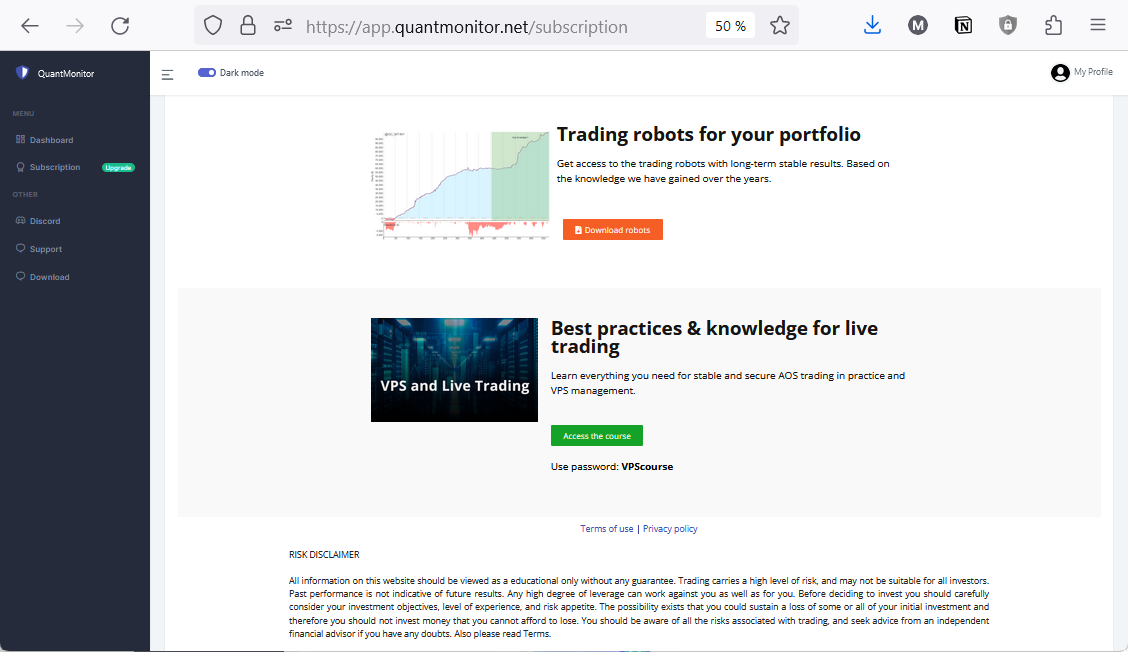
6. Automate your strategies: Once you have developed and tested your algo trading strategies, it is important to automate them. This will help you save time and effort in managing your strategies and make sure that they are running smoothly.

7. Monitor your performance: Once you have automated your algo trading strategies, it is important to monitor your performance. This will help you identify any potential flaws in your strategies and make adjustments accordingly.

Join the QuantMonitor Discord Community for Trading Insights and Connections!

We are excited to invite you to the QuantMonitor Discord community, where you can connect with our authors, other traders, and like-minded individuals. Our community offers a dynamic environment for discussion and learning about trading.

In our Discord community, you’ll have the unique opportunity to connect with the authors of QuantMonitor and engage in discussions about trading. You’ll gain valuable insights, share your own experiences, and learn from others in the industry. Whether you’re a seasoned trader or just starting out, our community has something to offer for everyone.

The biggest advantage of joining our Discord community is the connections you’ll make. You’ll find new friends and build relationships with people who share your interests and passion for trading. You’ll also have access to exclusive content and promotions, making our community the perfect place for traders.

So why wait? Join the QuantMonitor.net Discord community today and take your trading to the next level! Click on the Discord invite link to join us now. We can’t wait to see you in our community!

Trial StrategyQuant: A Guide to Using the Algorithmic Trading Software for FREE

StrategyQuant is a popular algorithmic trading software that allows traders to design, test, and execute automated trading strategies for Forex, stocks, options, and other financial markets. The software is known for its user-friendly interface, robust backtesting capabilities, and high accuracy in predicting market trends. In this article, we will walk you through the steps of how to get started with a trial of StrategyQuant.

Here is the Step by step guide

Step 1: Visit the StrategyQuant Website

The first step to getting started with StrategyQuant is to visit the official website at strategyquant.com. Here, you can find detailed information about the software, its features, and its pricing plans.

Step 2: Download the Trial Version

Once you have familiarized yourself with the software, you can download the trial version from the website. This version is fully functional and provides a great opportunity for traders to test the software and see how it works. The trial version is available for a limited time, usually 30 days, so it’s important to make the most of it during this period.

Step 3: Download and Install the Software

After downloading the trial version of StrategyQuant, you need to install it on your computer. The installation process is straightforward and can be completed in a few minutes.

Step 4: Create a Trading Strategy

Once you have installed the software, you can start creating your first trading strategy. StrategyQuant provides a simple and intuitive interface for designing and testing strategies. You can choose from a variety of indicators, signals, and other tools to build your strategy. The software also provides a backtesting feature that allows you to test your strategy on historical market data.

Step 5: Test the Strategy in the platform

After creating your strategy, it’s time to test it. The software’s backtesting feature allows you to evaluate the performance of your strategy on historical market data. This will give you a good idea of how the strategy would have performed in the past and whether it is suitable for trading in the present market conditions.

Don’t wait, start your trial of StrategyQuant today! Register for free at strategyquant.com and experience the power of algorithmic trading.

Getting Started with StrategyQuant: A Step-by-Step Guide for Algorithmic Traders

StrategyQuant is a comprehensive platform that allows traders to design, test and optimize algorithmic trading strategies. If you are looking to improve your algorithmic trading skills, this software is definitely worth considering.

Getting started with StrategyQuant can seem intimidating, but with a bit of patience and practice, you will be able to get the hang of it in no time. Here are some tips to help you get started:

  1. Familiarize yourself with the interface: The first step in using StrategyQuant is getting comfortable with its interface. Spend some time learning how to navigate the software and understand the different tools and features available to you. This will make it easier for you to use the software effectively.
  2. Be patient: StrategyQuant is a complex tool, and it takes time to master it. Don’t expect to create a winning strategy right away. Be patient and keep practicing until you become confident in your use of the software.
  3. Start simple: When you first start using StrategyQuant, it’s best to begin with a simple strategy. As you become more comfortable with the software, you can gradually increase the complexity of your strategies.
  4. Utilize tutorials and resources: StrategyQuant provides a wide range of tutorials and resources to help you get started. Make use of these resources to learn the software and improve your algorithmic trading skills.
  5. Experiment with different strategies: Finally, it’s important to experiment with different strategies and test their performance. This will give you a deeper understanding of how the software works and what strategies may be most effective.

In conclusion, with a little time and effort, anyone can become proficient in the use of StrategyQuant. Whether you are a seasoned algorithmic trader or just starting out, this software offers a wide range of features and tools that can help you reach your trading goals. So, take the time to learn it, and start taking advantage of its many benefits.

Try it for yourself for FREE: https://strategyquant.com/trial/

Unlock the Full Potential of Your Trading Strategies with StrategyQuant’s Robustness Tests.

Robustness testing can be utilized to develop and optimize strategies with StrategyQuant. Through simulations of different market conditions, StrategyQuant allows users to identify potential weaknesses in a strategy and determine whether it is robust enough to survive changing market conditions. By researching and analyzing the results of the robustness tests, users can gain insights into the strengths and weaknesses of their trading strategies and make informed decisions. With StrategyQuant’s powerful tools, users can ensure that their strategies are reliable and capable of delivering consistent returns over time. Walk forward testing and Monte Carlo tests also offer valuable insights into the risk and reward of a strategy, enabling users to optimize their strategies for maximum profitability. With StrategyQuant’s robustness tests, users can be sure that their strategies are well-equipped to handle the unpredictable nature of the markets.

Monte Carlo tests offer a powerful tool for strategy optimization and development. With StrategyQuant, users have access to a powerful Monte Carlo testing suite that allows you to simulate a range of market conditions. This helps to identify potential weaknesses in a strategy and ensure that it is robust enough to withstand changing market conditions. The Monte Carlo tests in StrategyQuant are designed to simulate a wide range of scenarios and provide users with valuable insights into the viability of a trading strategy. By running Monte Carlo tests, users can gain a better understanding of the risk and reward associated with a strategy, enabling them to make informed decisions and optimize their strategies for maximum profitability.

With StrategyQuant’s Monte Carlo tests, users can be sure that their strategies are robust and reliable. Walk forward testing is an essential part of any successful trading strategy. StrategyQuant offers a powerful walk forward testing suite that allows users to analyze the performance of a strategy over time. This helps to ensure that the strategy is robust enough to survive changing market conditions and identify potential weaknesses. Walk forward testing also enables users to optimize their strategies for maximum profitability, by making changes and adjustments based on the results of the tests. With StrategyQuant, users can be sure that their strategies are reliable and capable of delivering consistent returns over time. Walk forward testing helps to identify potential issues and gives users the opportunity to make informed decisions about their trading strategies.

Try it for yourself for FREE: https://strategyquant.com/trial/

StrategyQuant: The AI-Powered Algorithmic Trading Solution

Algorithmic trading has become an essential tool for traders who want to automate their strategies and achieve faster, more efficient trades. StrategyQuant is a leading software platform in this field, delivering a powerful, user-friendly solution that makes algorithmic trading accessible to everyone. With its advanced AI technology, StrategyQuant is changing the game for traders everywhere.

What sets StrategyQuant apart from other algorithmic trading platforms is its ability to generate new strategies automatically. The software leverages genetic algorithms and machine learning to create thousands of new strategies, which can then be tested and optimized for profitability. This groundbreaking feature makes it a game-changer for traders looking for new and innovative ways to trade the markets.

Not only does StrategyQuant make it easy to generate new strategies, but it also allows traders to backtest them across multiple instruments and timeframes. This helps traders assess the performance of their strategies in different market conditions, and make changes to improve their results. The software supports multiple order types, giving traders a great deal of flexibility in executing trades.

In addition to its core algorithmic trading capabilities, StrategyQuant offers a range of advanced features, including portfolio trading and strategy optimization. This allows traders to run multiple strategies at the same time and fine-tune their strategies for maximum profitability.

In conclusion, StrategyQuant is a mindblowing AI-based technology that is changing the game for algorithmic traders. Its user-friendly interface, advanced features, and ability to generate and backtest new strategies make it a top choice for traders looking to automate their trading and achieve better results.

Try it for yourself for FREE: https://strategyquant.com/trial/

Z-score

The Z-score is a statistical measure that represents the number of standard deviations a data point is from the mean of a dataset. It is used to identify outliers in the data and to assess the statistical significance of results. To calculate the Z-score, you need to know the mean and standard deviation of the dataset. Here is the formula for calculating the Z-score:

Z-score = (X – Mean) / Standard Deviation

Where X is the value of the data point, Mean is the mean of the dataset, and Standard Deviation is the standard deviation of the dataset.

For example, let’s say you have a dataset with a mean of 100 and a standard deviation of 10, and you want to calculate the Z-score for a data point with a value of 120. The Z-score would be calculated as follows:

Z-score = (120 – 100) / 10 = 2

This means that the data point with a value of 120 is 2 standard deviations above the mean of the dataset.

The Z-score can be used to identify outliers in the data by setting a threshold for the number of standard deviations a data point must be above or below the mean to be considered an outlier. For example, a data point with a Z-score of 3 or greater might be considered an outlier. The Z-score can also be used to assess the statistical significance of results by comparing the Z-score to a critical value from a standard normal distribution table. If the Z-score is greater than the critical value, the result is statistically significant.

Profit factor

To calculate the profit factor, you need to first calculate the total profit and total loss from your trades. You can then calculate the profit factor by dividing the total profit by the total loss.

For example, let’s say you made a total of 10 trades and had a total profit of $500 and a total loss of $300. The profit factor would be calculated as follows:

Profit Factor = Total Profit / Total Loss
= $500 / $300
= 1.67

This means that for every $1 you lose, you make $1.67 in profit. A profit factor greater than 1 indicates that you are making more profit than loss, while a profit factor less than 1 indicates that you are incurring more loss than profit.

It’s important to note that the profit factor is a useful metric, but it doesn’t tell the whole story. It can be influenced by the size of your wins and losses, and it doesn’t take into account the number of trades you make or the risk you take on. As such, it should be used in conjunction with other metrics to get a more complete picture of your trading performance.

There is no specific profit factor number that is considered “good” or “bad,” as this can vary depending on the specific trading strategy and market conditions. In general, a profit factor of 2 or higher is often considered to be good, while a profit factor below 1 indicates that you are incurring more loss than profit. However, these are just rough guidelines and may not be applicable in all cases.

For example, consider a trader who trades a very conservative strategy with a low profit factor of 1.2. This trader may be content with this profit factor if it allows them to consistently make small profits with a low risk of loss. On the other hand, a trader who takes on more risk and trades a more aggressive strategy may be able to achieve a higher profit factor, but also may be more susceptible to larger losses.

R expectancy

The R expectancy (or expected value of R) is a measure of the expected return of a trading system or strategy. It is calculated by multiplying the probability of a trade being successful by the potential profit of the trade, and then summing these values for all trades in the system or strategy. Here is the formula for calculating the R expectancy:

R Expectancy = Σ (Probability of Success * Potential Profit)

Where Σ represents the sum of the values, Probability of Success is the likelihood that a trade will be successful, and Potential Profit is the potential profit of the trade.

To calculate the R expectancy, you will need to gather data on the probability of success and potential profit for each trade in the system or strategy. You can then use this data to calculate the R expectancy using the formula above.

The R expectancy is a useful tool for evaluating the expected performance of a trading system or strategy and for comparing the expected returns of different systems or strategies. It can help traders to identify systems or strategies with a higher expected return and to make informed decisions about the level of risk they are willing to take in order to achieve those returns.

Example 1:

You have a trading system with the following trades:

Trade 1: Probability of Success = 60%, Potential Profit = $100
Trade 2: Probability of Success = 40%, Potential Profit = $200
Trade 3: Probability of Success = 50%, Potential Profit = $300

To calculate the R expectancy for this system, you would sum the products of the probability of success and potential profit for each trade:

R Expectancy = (0.60 $100) + (0.40 $200) + (0.50 * $300) = $180

This means that the expected return of the trading system is $180.

Example 2:

You have a trading strategy with the following trades:

Trade 1: Probability of Success = 70%, Potential Profit = $500
Trade 2: Probability of Success = 30%, Potential Profit = $1000
Trade 3: Probability of Success = 80%, Potential Profit = $2000
Trade 4: Probability of Success = 40%, Potential Profit = $3000

To calculate the R expectancy for this strategy, you would sum the products of the probability of success and potential profit for each trade:

R Expectancy = (0.70 $500) + (0.30 $1000) + (0.80 $2000) + (0.40 $3000) = $2300

This means that the expected return of the trading strategy is $2300.

I hope these examples help to illustrate how the R expectancy can be calculated for a trading system or strategy. Let me know if you have any questions or need further clarification.

Register for FREE and get access to:

By registering you agree with our Terms and Conditions