Trading encyclopedia

Setting Point Value, Tick Pip Step/Size for CFDs: A Step-by-Step Guide

When it comes to trading Contract for Difference (CFD), understanding the intricacies of the market is essential for success. One of the most important aspects of CFD trading is understanding the point value, tick pip step and size. In this article, we’ll explore these concepts, how to set them and provide recommendations for finding these values.

What are Point Value, Tick Pip Step, and Size?

Point Value: Represents the monetary value of one pip in the base currency of a CFD.

Tick Pip Step: Refers to the minimum price change of the underlying asset that a CFD can move in, expressed in pips.

Tick Pip Size: Represents the monetary value of one point in the base currency of the trading account, used to calculate potential profit or loss.

How to identify correct values in MT4/5?

First, you need to take a look at the chart for how many digits the instrument quoted.

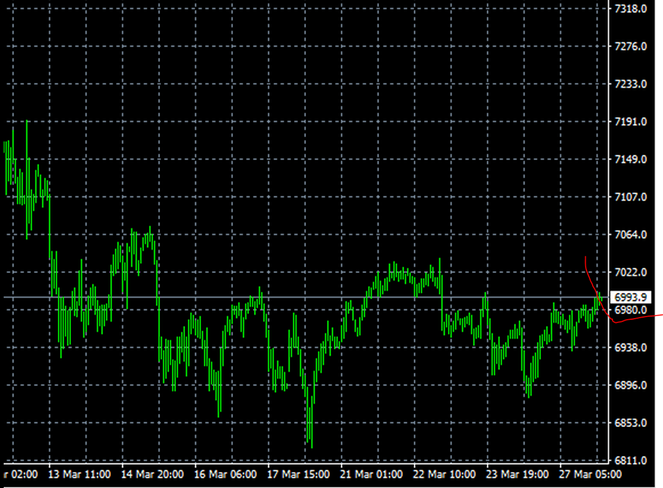
You can see that this ticker is quoted for one digit.

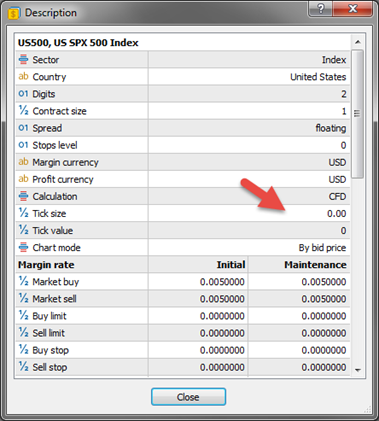
  • Now you can see the contract size, which is the point value in SQ X, and it represents the monetary value for one pip.
  • In the next step, you need to set the tick pip step and size correctly. Tick size represents the value for one pip. Additionally, you will find the tick pip step, which represents the smallest incremental movement for one pip.

Please note that the instrument setting is not always accurate, and sometimes the broker may not even display the point value correctly. You may need to experiment with it a little bit to ensure accuracy.

It is highly recommended that the results be verified on the broker platform using a well-chosen strategy, ensuring that the backtest aligns seamlessly with SQX. In doing so, a greater sense of confidence and success will undoubtedly be achieved in your trading endeavors.

Get access to the #1 Dashboard for AlgoTraders

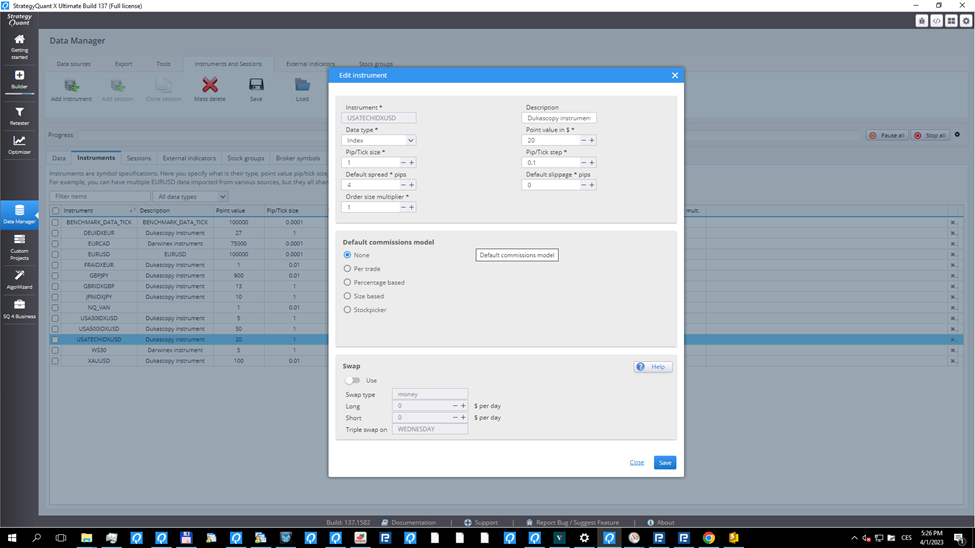
Setting Point Value, Tick Pip Step, and Size for CFDs in StrategyQuant

The instrument settings can effortlessly be edited in the data manager tab, empowering you to customize and optimize your trading experience with ease and precision.

Important note: Always, verify the results in the broker platform with some strategy and make sure that backtest matches with SQX.

Please, note that the point value in SQ X is calculated in USD so if some instrument is calculated in another currency for example AUD you need to convert the value to USD otherwise the results will be in the original currency

Examples of settings for Nasdaq CFD

IC Markets

Point value 1

Tick pip size 0.01

Tick pip step 0.01

Darwinex

Point value 20

Tick pip size 1

Tick pip step 0.1

Pepperstone

Point value 20

Tick pip size 1

Tick pip step 0.1

Dukascopy

Point value 1

Tick pip size 0.01

Tick pip step 0.01

Get access to the #1 Dashboard for AlgoTraders

F.A.Q.

Can I use the strategy developed on IC Markets with other Brokers?

The answer is yes and no. The problem with CFDs is that every broker can use their own settings of tick pip step/size and point value. So our recommendation is to always do the backtest on the target broker where you want to trade. If the backtest does not match the original, our recommendation is to build a new strategy.

Can I use the strategy developed for Futures data on CFDs?

No, the value of the tick pip step/size and point value is different, so the backtest in the platform will not match with the CFD broker.

How Swap Rates are Calculated in MetaTrader 4 and 5

If you’re new to trading forex or other financial instruments, you may have heard the term “swap” being used in MetaTrader 4 and 5. In this post, we’ll explain what swap is, how it works, and how you can use this information to improve your trading performance.

What is Swap?

In simple terms, swap is the interest rate that is charged or paid for holding a trading position overnight. It is also known as an overnight or rollover fee. When you open a trading position, you are essentially borrowing one currency to buy another. The interest rate on the currency you are borrowing is usually higher or lower than the interest rate on the currency you are buying. This difference in interest rates is reflected in the swap rate.

If the interest rate on the currency you are buying is higher than the interest rate on the currency you are selling, then you will earn a positive swap. This means that you will receive a small amount of money in your trading account for holding the position overnight. If the interest rate on the currency you are buying is lower than the interest rate on the currency you are selling, then you will incur a negative swap. This means that you will have to pay a small amount of money from your trading account for holding the position overnight.

How to View Swap in MetaTrader 4 and 5?

To view the swap rate for a currency pair in MetaTrader 4 and 5, you can follow these steps:

  1. Open the Market Watch window by clicking on View > Market Watch in the main menu.
  2. Right-click on the currency pair you want to view and select “Symbols” from the context menu.
  3. In the “Symbols” window, click on the “Properties” tab.
  4. You should now see the swap long and swap short values listed for that currency pair.

The swap long value represents the interest rate you will earn for holding a long (buy) position overnight, while the swap short value represents the interest rate you will pay for holding a short (sell) position overnight.

It’s worth noting that the swap rate can vary depending on the broker you are using and the currency pair being traded. Some brokers may also adjust their swap rates to reflect market conditions or other factors.

How to Use Swap to Your Advantage

Knowing the swap rate for the currency pairs you are trading can be useful in several ways. For example, you may choose to hold a position overnight if the potential profit from the trade exceeds the cost of the negative swap. Alternatively, you may decide to close a position before the end of the trading day to avoid paying a high negative swap.

Some traders may also use swap rates to inform their trading strategies. For example, they may look for currency pairs with high positive swaps and hold these positions over a longer period to maximize their returns.

Positive Swap:

Suppose you have a long position in the AUD/USD currency pair with a trading volume of 1 lot (100,000 units of the base currency – Australian dollar). The current interest rate on the Australian dollar is 0.5%, while the interest rate on the US dollar is 0.25%. The swap long rate for this currency pair is +3.3 pips.

In this scenario, you will earn a positive swap of $3.30 per day for holding the position overnight, as you are borrowing the US dollar and buying the Australian dollar, which has a higher interest rate. If you keep this position open for one week, you will earn a total of $23.10 in positive swap ($3.30 x 7 days).

Negative Swap:

Now suppose you have a short position in the EUR/GBP currency pair with a trading volume of 1 lot. The current interest rate on the euro is -0.5%, while the interest rate on the British pound is 0.1%. The swap short rate for this currency pair is -9.8 pips.

In this scenario, you will incur a negative swap of £9.80 per day for holding the position overnight, as you are borrowing the British pound and selling the euro, which has a lower interest rate. If you keep this position open for one week, you will have to pay a total of £68.60 in negative swap (£9.80 x 7 days).

It’s worth noting that swap rates can change over time, so a position that was earning a positive swap one day may earn a negative swap the next day. It’s important to stay informed about current swap rates for the currency pairs you are trading to make informed trading decisions.

Conclusion

In conclusion, swap is an important concept to understand in forex trading, as it can affect your trading profitability. By knowing how to view the swap rate in MetaTrader 4 and 5, and how to use this information to your advantage, you can make more informed trading decisions and improve your overall trading performance.

CAGR: Understanding the Concept and Its Practical Applications

Compound Annual Growth Rate (CAGR) is a financial metric used to measure the growth of an investment over a specified period of time. It is a smoothed and annualized rate of return that represents the average growth rate of an investment over a certain period. It gives a more realistic picture of the investment’s growth rate by taking into account the effects of compounding over time.

The formula for CAGR is: CAGR = (Ending Value / Beginning Value)^(1 / number of years) – 1

Here, the ending value is the value of the investment at the end of the specified period, and the beginning value is the value of the investment at the start of the specified period.

Practical Examples of CAGR

  1. Investment in the Stock Market One of the most common uses of CAGR is to measure the growth rate of an investment in the stock market. For example, if you invested $10,000 in a stock five years ago, and its value has increased to $15,000, the CAGR would be calculated as follows:

CAGR = ($15,000 / $10,000)^(1 / 5) – 1 = 0.10 = 10%

This means that the investment has grown by 10% annually on average over the last five years.

  1. Retirement Planning CAGR is also used in retirement planning to determine the growth rate of a retirement account over time. For example, if you are saving $5,000 annually for your retirement, and after 20 years, your retirement account has grown to $200,000, the CAGR would be calculated as follows:

CAGR = ($200,000 / ($5,000 * 20))^(1 / 20) – 1 = 0.06 = 6%

This means that the retirement account has grown by 6% annually on average over the last 20 years.

In conclusion, CAGR is a useful financial metric that provides a more accurate representation of the growth rate of an investment over time. It takes into account the effects of compounding and gives a more realistic picture of an investment’s performance. Whether you are investing in the stock market or planning for your retirement, understanding CAGR can help you make informed investment decisions and achieve your financial goals.

The Sharpe Ratio: Understanding and Using it for quant trading strategies

The Sharpe Ratio is a widely used metric for evaluating investment performance and risk-adjusted return. It measures the excess return per unit of risk taken by an investment and helps investors compare different investment options. In simple terms, the Sharpe Ratio indicates whether an investment’s returns are due to smart investment decisions or a result of excessive risk-taking.

The formula for the Sharpe Ratio is:

(Return of the Investment – Risk-Free Rate) / Standard Deviation of Returns

The risk-free rate is typically represented by the return on a government bond and is used as a benchmark for measuring an investment’s excess return. The standard deviation of returns measures the volatility of an investment’s returns.

An investment with a higher Sharpe Ratio is considered to be more attractive than an investment with a lower Sharpe Ratio as it indicates a higher return per unit of risk taken.

Example:

Consider two investments, Investment A and Investment B, with the following returns:

Investment A: 10% return with a standard deviation of 5% Investment B: 12% return with a standard deviation of 8%

Assuming a risk-free rate of 2%, we can calculate the Sharpe Ratio for each investment as follows:

Investment A: (10% – 2%) / 5% = 1.2 Investment B: (12% – 2%) / 8% = 0.7

In this case, Investment A has a higher Sharpe Ratio of 1.2 compared to Investment B’s 0.7, indicating that Investment A provides a higher return per unit of risk taken.

In conclusion, the Sharpe Ratio is a useful tool for evaluating investment performance and comparing investment options. By measuring the excess return per unit of risk taken, investors can make informed decisions about the potential return and risk of their investments.

Z-score

The Z-score is a statistical measure that represents the number of standard deviations a data point is from the mean of a dataset. It is used to identify outliers in the data and to assess the statistical significance of results. To calculate the Z-score, you need to know the mean and standard deviation of the dataset. Here is the formula for calculating the Z-score:

Z-score = (X – Mean) / Standard Deviation

Where X is the value of the data point, Mean is the mean of the dataset, and Standard Deviation is the standard deviation of the dataset.

For example, let’s say you have a dataset with a mean of 100 and a standard deviation of 10, and you want to calculate the Z-score for a data point with a value of 120. The Z-score would be calculated as follows:

Z-score = (120 – 100) / 10 = 2

This means that the data point with a value of 120 is 2 standard deviations above the mean of the dataset.

The Z-score can be used to identify outliers in the data by setting a threshold for the number of standard deviations a data point must be above or below the mean to be considered an outlier. For example, a data point with a Z-score of 3 or greater might be considered an outlier. The Z-score can also be used to assess the statistical significance of results by comparing the Z-score to a critical value from a standard normal distribution table. If the Z-score is greater than the critical value, the result is statistically significant.

Profit factor

To calculate the profit factor, you need to first calculate the total profit and total loss from your trades. You can then calculate the profit factor by dividing the total profit by the total loss.

For example, let’s say you made a total of 10 trades and had a total profit of $500 and a total loss of $300. The profit factor would be calculated as follows:

Profit Factor = Total Profit / Total Loss
= $500 / $300
= 1.67

This means that for every $1 you lose, you make $1.67 in profit. A profit factor greater than 1 indicates that you are making more profit than loss, while a profit factor less than 1 indicates that you are incurring more loss than profit.

It’s important to note that the profit factor is a useful metric, but it doesn’t tell the whole story. It can be influenced by the size of your wins and losses, and it doesn’t take into account the number of trades you make or the risk you take on. As such, it should be used in conjunction with other metrics to get a more complete picture of your trading performance.

There is no specific profit factor number that is considered “good” or “bad,” as this can vary depending on the specific trading strategy and market conditions. In general, a profit factor of 2 or higher is often considered to be good, while a profit factor below 1 indicates that you are incurring more loss than profit. However, these are just rough guidelines and may not be applicable in all cases.

For example, consider a trader who trades a very conservative strategy with a low profit factor of 1.2. This trader may be content with this profit factor if it allows them to consistently make small profits with a low risk of loss. On the other hand, a trader who takes on more risk and trades a more aggressive strategy may be able to achieve a higher profit factor, but also may be more susceptible to larger losses.

R expectancy

The R expectancy (or expected value of R) is a measure of the expected return of a trading system or strategy. It is calculated by multiplying the probability of a trade being successful by the potential profit of the trade, and then summing these values for all trades in the system or strategy. Here is the formula for calculating the R expectancy:

R Expectancy = Σ (Probability of Success * Potential Profit)

Where Σ represents the sum of the values, Probability of Success is the likelihood that a trade will be successful, and Potential Profit is the potential profit of the trade.

To calculate the R expectancy, you will need to gather data on the probability of success and potential profit for each trade in the system or strategy. You can then use this data to calculate the R expectancy using the formula above.

The R expectancy is a useful tool for evaluating the expected performance of a trading system or strategy and for comparing the expected returns of different systems or strategies. It can help traders to identify systems or strategies with a higher expected return and to make informed decisions about the level of risk they are willing to take in order to achieve those returns.

Example 1:

You have a trading system with the following trades:

Trade 1: Probability of Success = 60%, Potential Profit = $100
Trade 2: Probability of Success = 40%, Potential Profit = $200
Trade 3: Probability of Success = 50%, Potential Profit = $300

To calculate the R expectancy for this system, you would sum the products of the probability of success and potential profit for each trade:

R Expectancy = (0.60 $100) + (0.40 $200) + (0.50 * $300) = $180

This means that the expected return of the trading system is $180.

Example 2:

You have a trading strategy with the following trades:

Trade 1: Probability of Success = 70%, Potential Profit = $500
Trade 2: Probability of Success = 30%, Potential Profit = $1000
Trade 3: Probability of Success = 80%, Potential Profit = $2000
Trade 4: Probability of Success = 40%, Potential Profit = $3000

To calculate the R expectancy for this strategy, you would sum the products of the probability of success and potential profit for each trade:

R Expectancy = (0.70 $500) + (0.30 $1000) + (0.80 $2000) + (0.40 $3000) = $2300

This means that the expected return of the trading strategy is $2300.

I hope these examples help to illustrate how the R expectancy can be calculated for a trading system or strategy. Let me know if you have any questions or need further clarification.

Register for FREE and get access to:

By registering you agree with our Terms and Conditions